What does the End of Global Poverty look like?
When does poverty end for an individual or country?
The UN debate on ending global poverty and the forthcoming sustainable development goals has tended to focus on very poor people often defined as the few-dollars-a-day poor (see here) amid calls for foreign aid to focus solely on the poorest countries. But does poverty really end at $1 or $2 per day per person?
The long-standing global poverty line of a dollar a day (currently, $1.25) is now redundant due to new price data it seems. So there’s a serious question about when does monetary poverty end?
Estimates for global multi-dimensional poverty, that is poverty measured as a set of deprivations in health, education and nutrition, are 1.6bn global poor.
That might suggest setting the global monetary poverty at $2.50 per day (2011 PPP) because there are 1.6bn poor or the poorest quarter of world population live under that level of expenditure. However, it may well be that some of these aren’t the same 1.6bn people – people may be poor by $2.50 monetary poverty but not poor by non-monetary dimensions and vice versa.
Whilst income and expenditure are important components when measuring poverty, measuring broader wellbeing as a whole by, considering indicators such as life expectancy or its determinants including health, nutrition and education as well as income, provides a more rounded indication of whether an individual, household or society is living well or not.
However, this is not a preamble to re-inventing multi-dimensional poverty. Instead it is an idea for how to set a new global monetary poverty line. Put another way: using a non-income measure to justify an approach to defining monetary poverty (and applicable for a person or country).
Here is the basic idea: Life expectancy rises with consumption, but that rise levels out at a fairly moderate level of consumption. Where the level of consumption stops contributing to higher life expectancy, or at least, its contribution slows down a lot, might be a reasonable place to think about what should count as a minimum global standard of living.
We’re not the first to think about this of course. The US demographer, Samuel H. Preston first identified a relationship between income and life expectancy, sparking interest into the nature of the correlation (aka the Preston Curve). More recently, Peter Edward at Newcastle University proposed an ethical poverty line using this approach.
In short, an approach to setting a new global monetary poverty line might be to consider the point at which life expectancy is no longer curtailed to a significant extent by under-consumption. One could also use that logic to consider when a country is not poor too.
First, taking the last 20 years of life expectancy data, the starter question to ask is what level of life expectancy to aim for?
Currently, the global average life expectancy in is about 70 years although that ranges widely, from 45 years in Sierra Leone to more than 80 years in France, Switzerland, Iceland, Italy, Japan and Hong Kong.
Presumably, one would want to minimally aspire to a life expectancy around the world of the rich countries, the OECD countries.
What the minimum that would be? The country with the lowest life expectancy in the OECD over the last twenty years has consistently been Turkey. Over the last twenty years life expectancy in Turkey has averaged 70 years (and is 75 years in the most recent data).
Next, we take all the data for those last twenty years from every country. For individual poverty we use household final consumption expenditure per person. This is the value of all goods and services purchased by households. It is a national per person average.
Then we can consider what consumption levels are associated with a life expectancy of 70 years.
At a country level, one might also say a country is still poor if GDP PPP per person is still below the point where additional GDP PPP per person makes a significant difference to the average life expectancy of its citizens. So to consider countries, we can take GDP per person. All data are in 2011 purchasing power parity rates (PPPs).
The variables used differ between a person and a country because GDP includes what one could call ‘societal savings’ – savings of governments and companies.
What does the data say? Life expectancy of 70 years for individuals is associated with something not too far from $15 per day expenditure (see figure 1). And life expectancy of 70 years for countries is associated with around $25/day output (see figure 2).
Figure 1 shows life expectancy versus household expenditure final consumption (2011 PPP), and Figure 2 shows life expectancy versus GDP per person (2011 PPP).
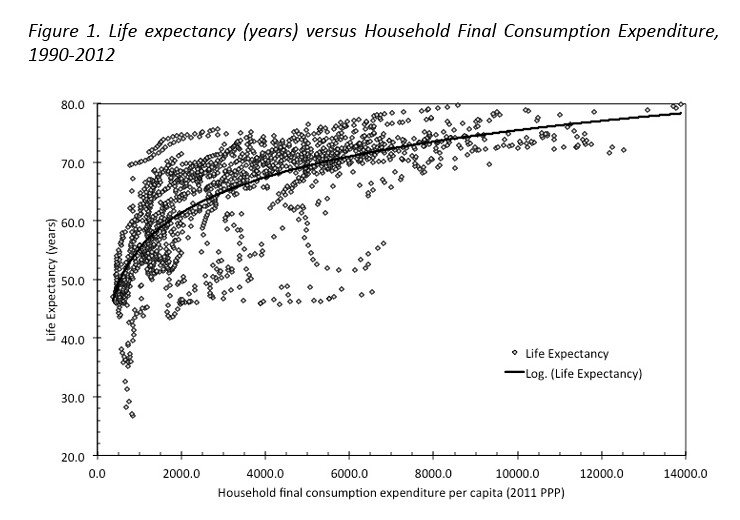
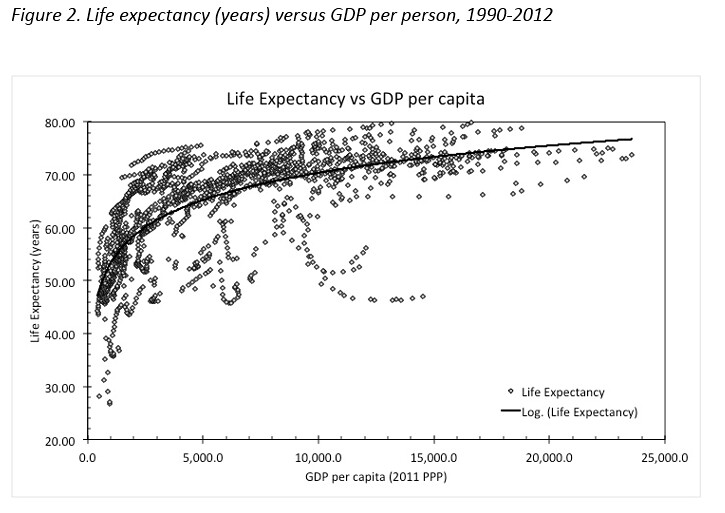
Of course some countries achieve higher life expectancy at less. For example, Vietnam, achieved a life expectancy of 70 years at just $4-$5 GDP PPP per person and achieved 75 years, the same as Turkey now, at just $10 per person and yet Turkey’s GDP PPP per person is now almost $50 per day. In contrast, Nigeria has virtually the same GDP PPP per person as Vietnam but life expectancy of only just above 50 years.
In short, life expectancy close to the lowest country in the OECD could be reached at about just $4-$5 GDP per person per day but that is by no means guaranteed and one would guess public policies on health, education and nutrition as well as governance and the general social policy regime and nature of growth all likely contribute to a lower life expectancy.
On average the graph suggests something more like $15 per day for a person and $25 a day for a country to be considered not poor under this approach.
What if we take 65 years life expectancy on the basis that surely we want the aspiration to be on average people live to the average retirement age in OECD countries at least? We would then be closer to something like $10 a day for a person or $15 a day for a country.
But an important caveat – life expectancy here is a societal measure so one would really need to get the distribution of life expectancy across the entire expenditure distribution and find the median but that data doesn’t easily exist – one would need comparable surveys that asked what did you spend last month and by the way, did anyone die in your household last month?
Further, we don't only need to know how average life expectancy breaks down from the national to the individual level but we also need to know how average consumption per capita breaks down. At present at least, the life expectancy data is not easily and readily available so we just have to run with averages. But the individual consumption data is available so on that side at least one could move beyond national averages.
If the Preston curve that links consumption or output and life expectancy is valid at the individual level across countries then for two countries with similar household consumption per capita the average life expectancy could be very different. Then we could probe further and possibly one could develop the individual consumption data at the country level.
So, we are not suggesting that the relationship between expenditure and life expectancy is consistent within a country - indeed both are distributed unevenly as is well known but the idea at least does provide a potential approach to a global poverty line or average for countries and individuals.
One final thing to note is that $10 or $15 per day may sound extravagant when compared to one or two dollars a day but it isn’t that wild a lifestyle – in fact it’s not far from the US poverty line.
And a global poverty line closer to $1 or $2 per person is actually falling off the end of the curve – it is associated with life expectancy of about 50 years or so. Which would be a very low aspiration indeed.


