When Does One Dime = 100 Million People?
Ending extreme poverty is likely to be one of the UN Sustainable Development Goals for 2030. So it is a good idea to figure out what that entails. And it turns out that it’s become more complex in the last year or so. That’s because new price data, 2011 Purchasing Power Parity (PPP) estimates, were released in 2014 and the World Bank’s global poverty database, PovcalNet, also had a substantial update.
The methodology for the 2011 price data is thought to be superior to that used for the previous 2005 PPP rates. However, using the new 2011 PPPs to estimate global poverty and inequality remains contentious.
The changes to the PPPs are not trivial for many countries and in particular a number of populous countries that matter to both global poverty and global inequality estimates have quite different data in 2005 and 2011 PPPs.
In a new CGD Working Paper, Peter Edward and I take a closer look.
We make new estimates of global poverty and inequality for 1990 (the year of the MDG baseline) up to 2012 and make some projections to 2030 for global poverty using various poverty lines. We ask how much difference the choice of price data makes to those estimates of global poverty and inequality.
First, how many poor people are there in the world and where do they live? It really depends on the new global poverty line taken. We outline five possibilities each with a global logic.
It might seem that because the 2011 PPPs effectively halved estimates of global poverty at the ‘extreme’ global poverty line (equivalent to $1.25 a day in 2005PPP) they have caused a major change in our understanding of the scale of global poverty. But in our paper we argue that the revision of the PPPs merely reminds us of the problems of focusing on lower poverty lines where poverty estimates are hypersensitive to both the value of the PPP$ poverty line and to changes in the value of the PPP rates.
In fact, changing a global poverty line by a dime - 10 US cents – can make a difference to global poverty of the order of 100 million people (though this is a generic point rather than related to the PPP revision).
Taking a wider perspective on the global distribution the impact of the new PPPs is considerably less substantial than it may have first appeared. Differences in poverty estimates between the PPP rates are much smaller as the poverty line rises above $5 a day and, notably, the number of people living at or below the peak of the global distribution curve has remained steady at 33% throughout the period 1990-2012, being the same whether one uses 2005PPP or 2011PPP.
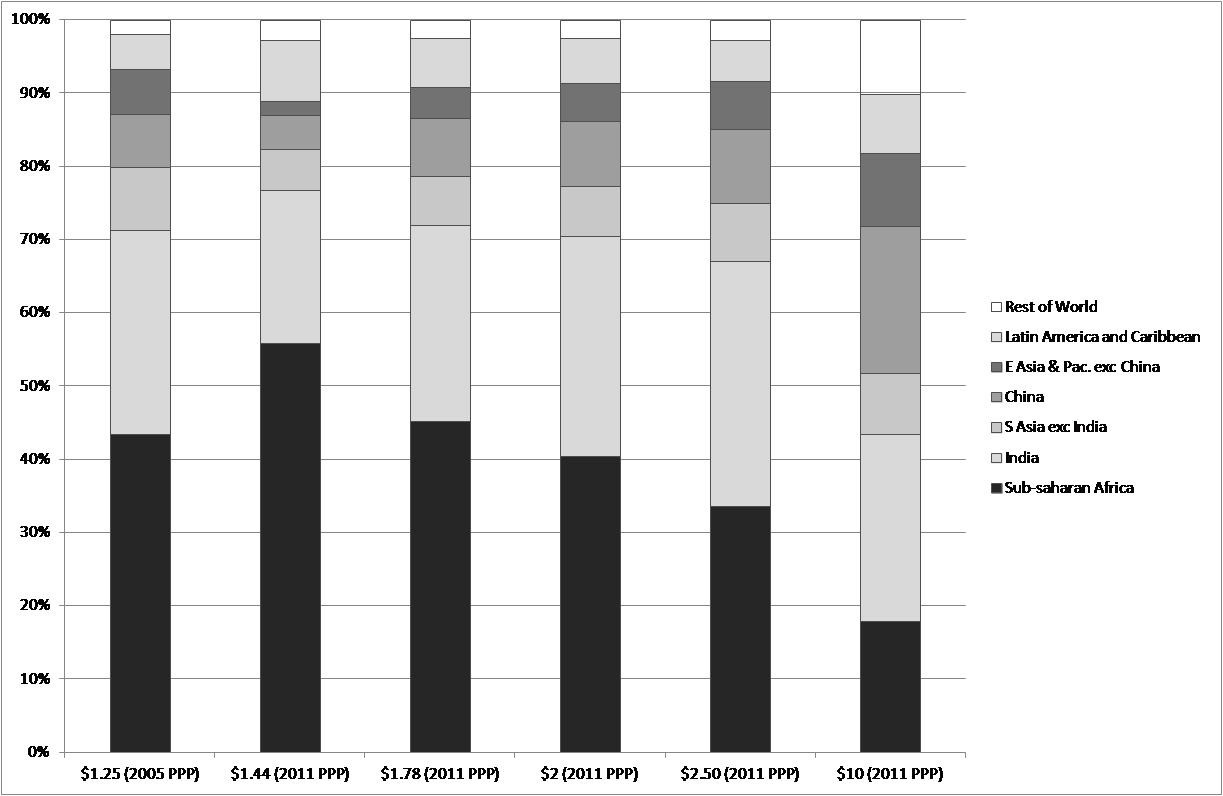
The PPP revision and the poverty line taken also changes where we think the global poverty is focused. The world’s poor live in fragile states, and largely in Africa, right? What we find is that, as noted by Angus Deaton, at the last PPP revision is that lower poverty lines ‘Africanise’ poverty and very marginally higher poverty lines ‘Asianise’ poverty. We find that lower poverty lines also shift the burden of global poverty towards the least developed or low income countries, and towards fragile states. Conversely, only very slightly higher poverty lines shift the burden of global poverty away from such countries.
Figure 1: How many poor people are there? Estimates of global poverty at various poverty lines, millions, 1990-2030 using 2011PPP (projections from 2012 based on IMF WEO minus 1% and current inequality trends)
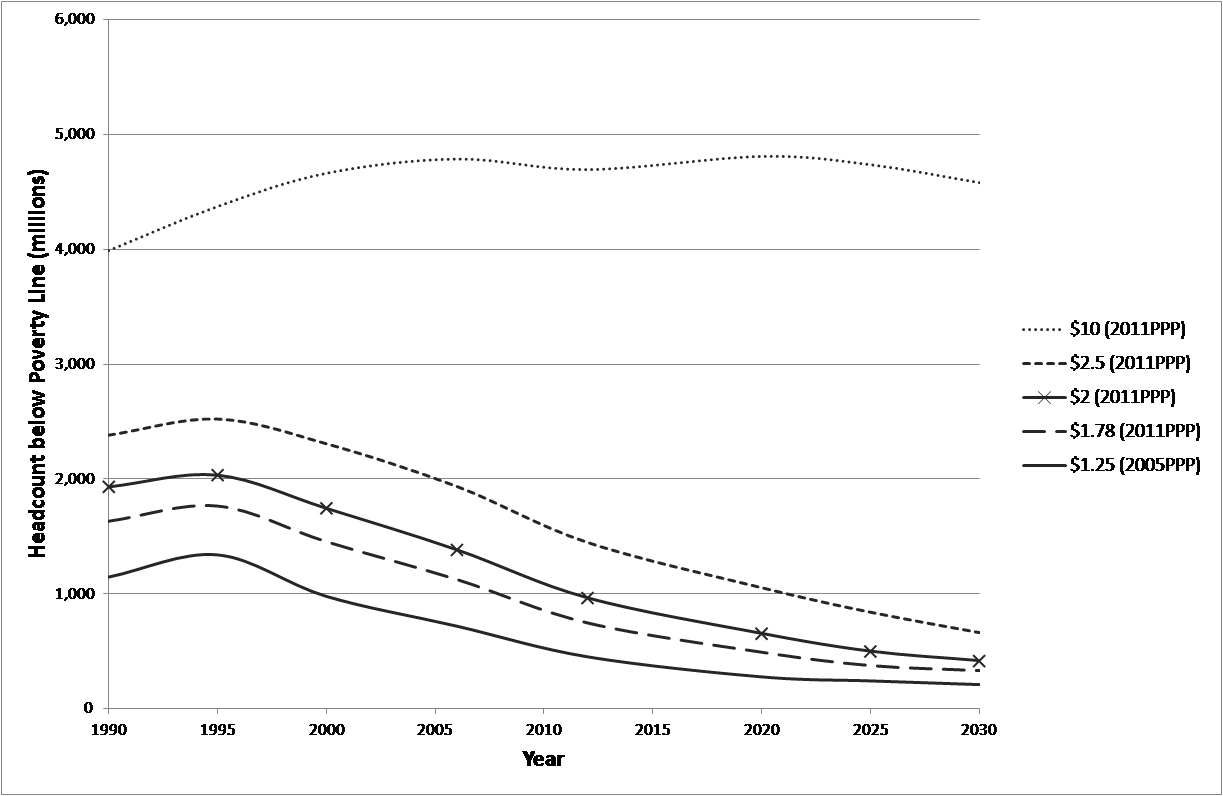
Figure 2: Where do the world’s poor live? The distribution of global poverty (% global total) by region, 2012, by 2005 PPPs and 2011 PPPs
But before we get too carried away, it is worth noting that the PPP revision does not change what people actually consume in real life. What it does change is our estimates of the value of what they consume have changed – so that implies that our poverty lines should change.
We are, of course, not the first in this space. Others have addressed some of these questions with preliminary estimates in blogs taking the ‘new’ (2011) PPP and making estimates for global poverty in 2010 based on various adjustments to the $1.25 poverty line. They found that the new PPP rates substantially reduced poverty estimates.
The updated PPP figures, we argue, therefore raise questions about the usefulness and relevance (again) of relying on a single global poverty line for any post-2015 goals, and especially one that is set low, because such estimates of global poverty are hypersensitive to minor changes at the lower tail of the global distribution (while not taking into account what is happening across the entire global distribution).
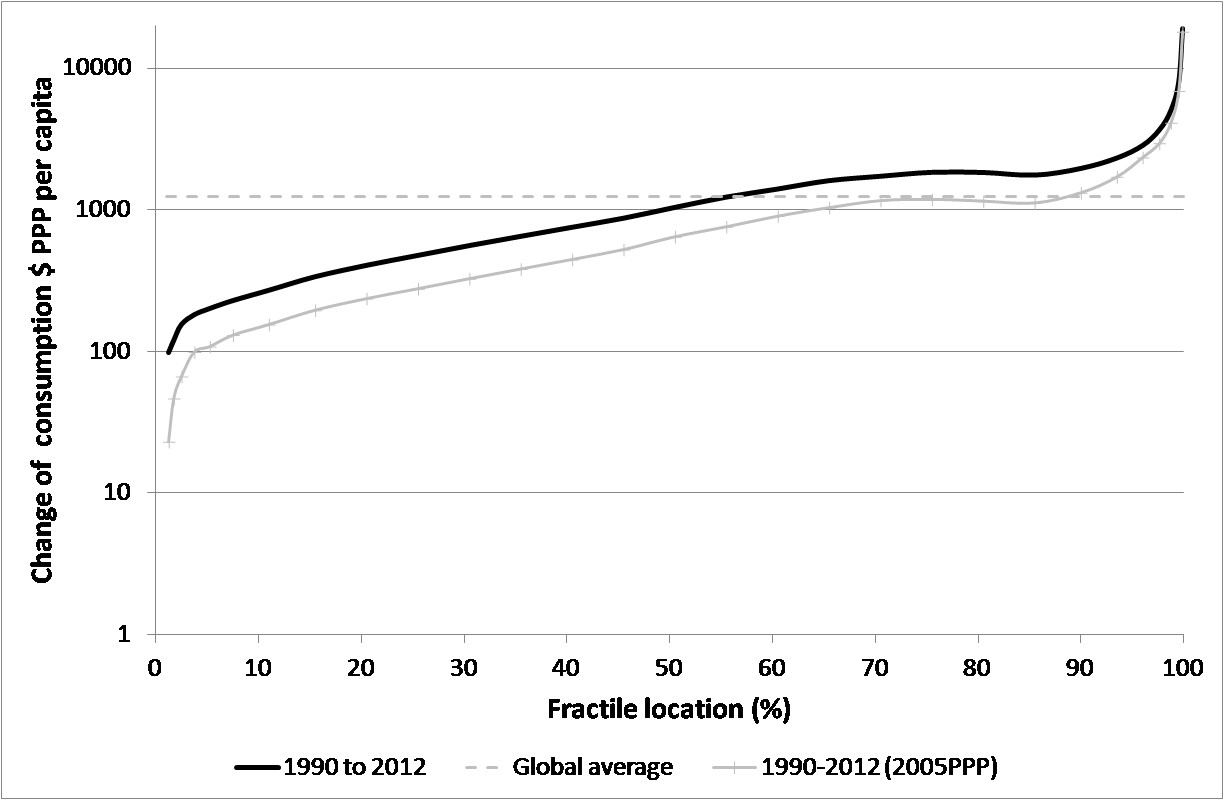
If one compares the entire 1990-2012 period, our estimates of the distribution of benefits of economic growth differ relatively little whether one uses 2005PPPs or 2011PPPs: in the poorest half of the global population, the curve rises slightly – perhaps in the order of 10% if one uses 2011PPPs rather than 2005PPPs. This might sound significant but in absolute terms it is small.
Figure 3: Who benefitted and how much from global growth, 1990-2012? Absolute benefits: Global growth incidence curve, survey means, 1990-2012 (2011PPP unless stated, log scale)
We also find that the primary difference in the global distribution between use of 2005 PPP and 2011 PPP is less than it may at first seem. The commonality is that the clear global ‘twin peaks’ demarcation between a poor peak and a rich peak that existed at the end of the Cold War is no longer so readily discernible.
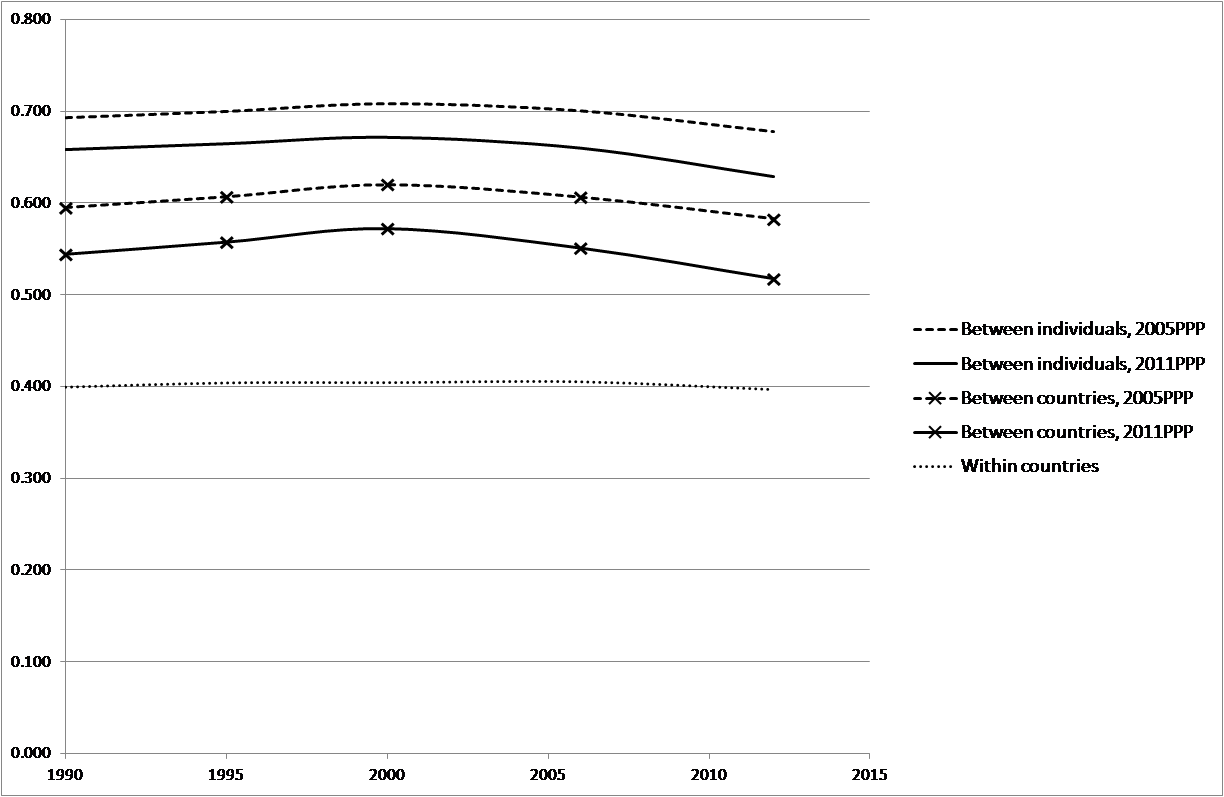
Furthermore, although global inequality is lower if one uses 2011PPP, the change is not that large and the much heralded fall in global inequality since the end of the Cold War almost evaporates when China is removed whether one uses 2005 or 2011 PPPs. Global inequality between countries is about the same as inequality within Brazil and global inequality between individuals is still about the same as inequality in South Africa.
Figure 4: Has global inequality fallen that much when China is excluded? Effect of PPP rates on evolution of global Ginis (excluding China)
What to conclude?
We think that it is important to consider what is happening across a wider range of poverty lines and to understand the (relatively slowly) changing shape of global consumption distribution.
Approaches to global poverty need to be informed by a broader understanding of the overall global consumption distribution and of how very modest changes to the assumed poverty line lead to significantly different understandings of the scale and location of global poverty. It would therefore be better, we suggest, to make estimates with a range of poverty lines, probably up to at least $10-a-day, so as to pay greater attention to the global distribution overall.
Stop the press: this paper just out by the World Bank is worth a look on the same subject.
This paper first appeared on the Center for Global Development's blog.
Photo credit: Meanest Indian / Photo / CC BY-ND
The Donors’ Dilemma: Emergence, Convergence and the Future of Aid – A Global Policy E-book edited by Andy Sumner
As poverty declines, what if the remaining pockets of poverty are increasingly focused in countries where aid is already on the way to becoming irrelevant as domestic resources grow - such as some middle income countries - or in countries which cannot absorb aid easily and quickly – meaning many fragile states?
This is the question addressed by contributors to Global Policy’s first e-book entitled ‘The Donors’ Dilemma: Emergence, Convergence and the Future of Aid', guest edited by Dr Andy Sumner, Co-Director, King’s International Development Institute, King’s College London.
Written by world renowned academics and practitioners, contributions will initially be serialised on the Comment and Opinion page of the Global Policy website, and subsequently released as a freely accessible GP e-book in the first quarter of 2014.
Readers are encouraged to leave comments below each piece or join the debate by using the tag #GPfutureofaid on Twitter.
To purchase the entire e-book for $2.99 please click here (for the Amazon Kindle version please click here) or find the individual commentaries below:


