A Strategic Roadmap to Thread Global Warming’s Risks

Frustrated by decades of inaction on global warming, Les Coleman finds that its adverse impacts are concentrated in particular areas and so are best tackled by the proven strategy of fixing sustainability problems as they arise, rather than seeking pre-emptive global restructures that are proving impractical.
There can be no doubt that the globe has warmed by over 10C since the 19th century, and - as shown in figure 1 - has done so in lockstep with the level of carbon dioxide (CO2) in the atmosphere and global energy consumption. Warming over land has been about twice that over the ocean.
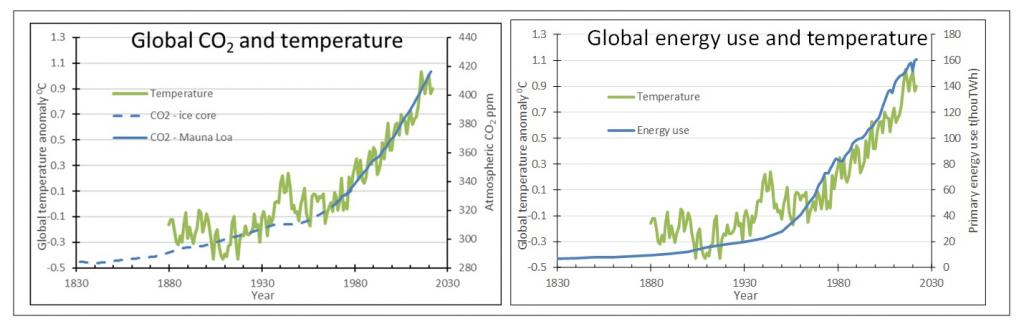
Figure 1. Global temperature versus atmospheric CO2 and energy consumption.
Not surprisingly people are engaged by the United Nations statement that “human-induced climate change is the largest, most pervasive threat to the natural environment and societies the world has ever experienced”. The most cited direct effects are increased heat-related illnesses, more severe storms, increased drought and wildfires, melting ice sheets, and sea level rise (see United Nations and World Wildlife Fund).
Following a century of warming, its impacts should be obvious. Figure 2 offers a reality check by using illustrations from peer reviewed sources of warming’s risks going back 50+ years.
Starting with human lives, there have been sharp falls in global mortality from disasters which declined from around 20 per 100,000 population at the start of the 20th century to below 0.5 in the last decade. Not shown in the figure is that excess deaths due to climate extremes also declined by 0.3 percent this century after a drop of 0.51 percent due to cold temperatures offset by a 0.21 increase for hot temperatures. In addition, annual mortality from all causes has fallen from 20 per 1,000 population in the mid 20th century to eight this decade.
Turning to causes of the worst natural disasters, the frequency of tropical storms – both hurricanes and cyclones – has been unchanged in the last 50 years, while the area burned by wildfires has fallen by about a third in the last century. Since 1950, drought has increased the area of crops exposed to hot and dry extremes to about 2.5 percent, which is equivalent to doubling in the area affected every two centuries.
There has been a decline in Arctic sea ice extent in the last century, which ranges from about six percent in Spring to almost half in Autumn-Winter. This contributed to a rise in sea level since 1900 of about 0.2 metres, which is several times the rate of previous centuries.
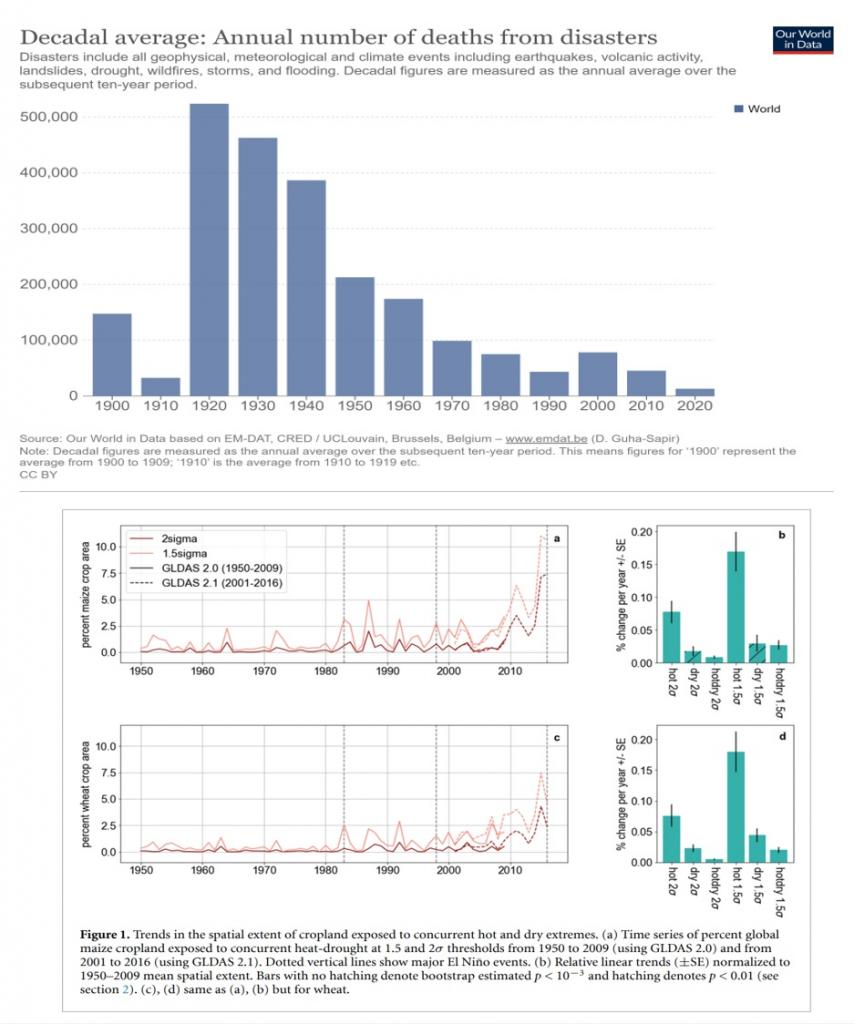
Figure 2. Changes in key threats from global warming
These facts pose two questions for policy. The first relates to the cost/benefit trade-off from reversing the build-up of CO2. Most studies expect that continued warming will have uncertain, but probably a small impact on global GDP. For example, Swiss Re estimated that a 2.60 C temperature rise by 2050 would reduce global GDP by 14 percent relative to zero warming (i.e. 0.4 percent PA). By contrast, a McKinsey study found that “achieving net zero emissions by 2050 would entail a fundamental transformation of the global economy” that would cost $275 trillion, or about three years of global GDP. That is, expenditure required to stabilise emissions would be 20 times the damage avoided.
The second critical policy question is whether reversing the build-up of CO2 will actually reverse warming. This is not semantics. Although CO2 may be the proximate cause of warming, it does not increase on its own, but responds to underlying drivers. Thus the Sixth Assessment Report (SAR 6) of the United Nations Intergovernmental Panel on Climate Change (IPCC) says (WG111, page 245): “economic growth (measured as GDP) and its main components, GDP per capita and population growth, remained the strongest drivers of GHG emissions in the last decade.” This is shown in figure 3 where temperature has closely tracked growth in global population and income per capita since the 19th century.
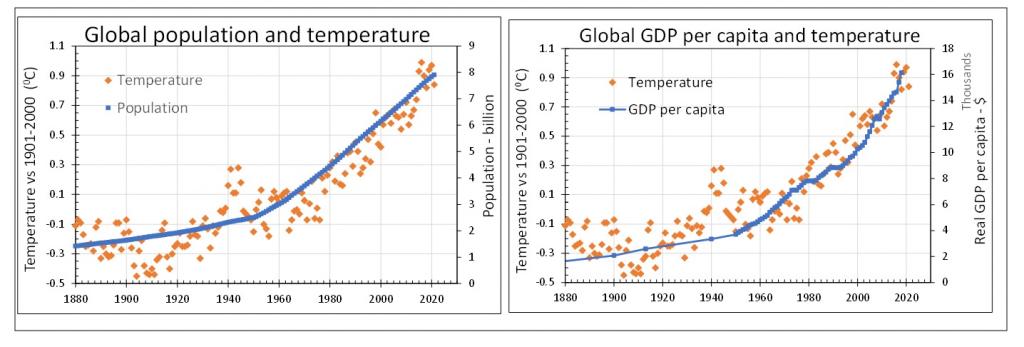
Figure 3. Global warming tracks population and per capita GDP.
To summarise, global indicators that are linked directly to temperature - that is: deaths from temperature extremes, drought, sea ice, and sea level - responded predictably to warming; whereas risks with only an indirect link - wildfires, tropical storms, and disasters - had no change or lessened. The net is that – after a century of global warming – of its seven most feared risks: three have improved (disasters, deaths from temperature extremes, wildfires) and one has not changed (tropical storms).
Tangible damage from global warming is largely confined to a slight increase in drought affected area and the effects of warmer oceans, especially on marine species such as coral and fish. Warming has a clear association with carbon dioxide, but its ultimate causes are growth in global population, wealth and energy consumption. From an economic perspective, warming will have an uncertain, but small, impact on GDP, while costs of stabilising emissions will be an order of magnitude higher than damages avoided.
Turning to appropriate policy response, experience through the last five decades has shown that efforts by the United Nations and scientists to develop workable climate policies have failed. As I have written, there is no longer any point in looking to them for leadership, and global solutions are impractical.
More constructively, the world gained considerable experience with responding to existential risks during its industrial growth and urbanisation. Unfortunately susceptible species and a majority of wild animals were eliminated, but other externalities, or unwanted effects, were managed effectively by end-of-pipe solutions. These mitigate problems as they arise, with typical examples in air conditioning desert homes and building levees to protect floodplains. This approach is particularly relevant for global warming because its adverse effects tend to be concentrated in particular regions, and there is little economic justification for anything more than targeted protection, especially against sea level rises.
The targeted control of emissions is also practical because – even though warming is a global problem - greenhouse gas emissions are highly concentrated, with over 70 percent from just ten countries: China, United States, India, Russia, Japan, Iran, Germany, Saudi Arabia, Indonesia and South Korea. Achieving change in polluting countries’ behaviour requires coalitions of nations that demand sustainable products to impose tough trade sanctions and ESG-driven finance.
Emissions by individuals are also concentrated, with Oxfam reporting that the richest one percent of people cause 15 percent of emissions through their investments and spending. Expenditure by these and other consumers represents about half the GDP of most countries and optimising it would force re-engineering products and processes to be more sustainable. Necessary behavioural change needs tough domestic policies with carrots through better consumer information and performance data to promote collective action that starves unsustainable organisations of funds, respect and relevance.
In short, breaking away from an unsustainable future requires leaders to get smarter about policy, take human nature into account and develop a Yalta-heft pact with policies that restructure the way people live, work and play.
Les Coleman is an honorary fellow at the University of Melbourne. He worked for 28 years with resources, distribution and finance companies in Australia, Fiji, USA and Zambia, and spent 19 years as a finance academic. His latest book is Research in Crisis (Routledge, London, 2021) and other publications are here.
Photo by cottonbro studio
References
Figure 1
Data sources: global temperature - NOAA available at www.ncei.noaa.gov; CO2 1832-1978 US DOE (1998). Historical CO2 records from the Law Dome DE08, DE08-2, and DSS ice cores. Washington DC Available at: https://data.ess-dive.lbl.gov/view/doi:10.3334/CDIAC/ATG.011; CO2 since 1958 NOAA available at https://gml.noaa.gov/ccgg/trends/); primary energy consumption (https://ourworldindata.org/grapher/global-energy-consumption-source?facet=none.
Figure 2:
Disaster deaths - Our World in Data based on EM-DAT, CRED, available at https://ourworldindata.org/grapher/decadal-average-death-rates-from-natural-disasters; tropical storm frequency - R. N. Maue (2023). Hurricanes and Climate Change. Available at: https://climatlas.com/tropical/; area burned by wildfires - Arora, V. K. and J. R. Melton (2018). "Reduction in global area burned and wildfire emissions since 1930s enhances carbon uptake by land." Nature communications 9(1): 1-10.; drought - Lesk, C. and W. Anderson (2021). "Decadal variability modulates trends in concurrent heat and drought over global croplands." Environmental Research Letters 16(5): 055024.; Arctic sea ice - Walsh, J. E., F. Fetterer, J. Scott Stewart and W. L. Chapman (2017). "A database for depicting Arctic sea ice variations back to 1850." Geographical Review 107(1): 89-107.; sea level rise - Frederikse, T., F. Landerer, L. Caron, S. Adhikari, D. Parkes, V. W. Humphrey, S. Dangendorf, P. Hogarth, L. Zanna and L. Cheng (2020). "The causes of sea-level rise since 1900." Nature 584(7821): 393-397.
Figure 3:
Global temperature - NOAA available at www.ncei.noaa.gov; population - Population, 10,000 BCE to 2021 (https://ourworldindata.org/population-growth); GDP - World GDP over the last two millennia (https://ourworldindata.org/grapher/world-gdp-over-the-last-two-millennia)


