From Reports to Results: Unlocking Big Data through Geographical Information Systems in the Extractive Industry

This post represents the third in a series of opinion pieces from the ongoing 2016 EITI Conference, in Lima, Peru being covered on the ground by the Global Leadership Initiative's team. Please check in regularly to keep up to date with the latest news and analysis from the summit. For previous posts please click here.
The fundamental challenge for the 7th Global EITI conference is to make the technical reports deliver results. After years of training governments and civil society in the Global South, many citizens from EITI countries now have access to complex information about how contracts are awarded to their countries, the enormous domestic revenues governments receive, and how this revenue is being allocated through government spending. However, more needs to be done to ensure that transparency reporting leads to more informed dialogue, better decision making and ultimately stronger results.
In order to address some of the challenges relating to visualising large data sets, the EITI organised a Data Storytelling Bootcamp aimed at showcasing various methods of tackling the problems of Big Data. This blog focuses on unlocking, visualising and using EITI data for decision making with specific emphasis on the role of Geographical Information Systems (GIS) and developments from Mapping and Assessing the Performance of Extractive Industries (MAP-X). In other words, Big Data is now a useful tool for enhancing accountability.
Data Storytelling Bootcamp Discussions
The Data Storytelling Bootcamp took place during the EITI summit. It raised excellent points of discussion, in particular the potential for GIS mapping to translate EITI reports into interactive data to understand the changes in the Extractive Industry. The engagement from various stakeholders was very positive, with excellent interaction with representatives from the National Resource Governance Institute, World Resource Institute, the Katanga Tax Collection Agency and the Minister of Environment from the DRC all contributing to the potential and challenges associated with the use of big data related technologies.
Many participants felt that while specific information about contracts exist thanks to the EITI process, this can be more effectively presented through interactive maps. GIS can also demonstrate how contracts have evolved over time, providing clear indication where mining revenues may have decreased.
Finally, there was an overall recognition from all parties of the promise of GIS mapping and open data formats in making them a key element for future EITI reports.
Useless Data?
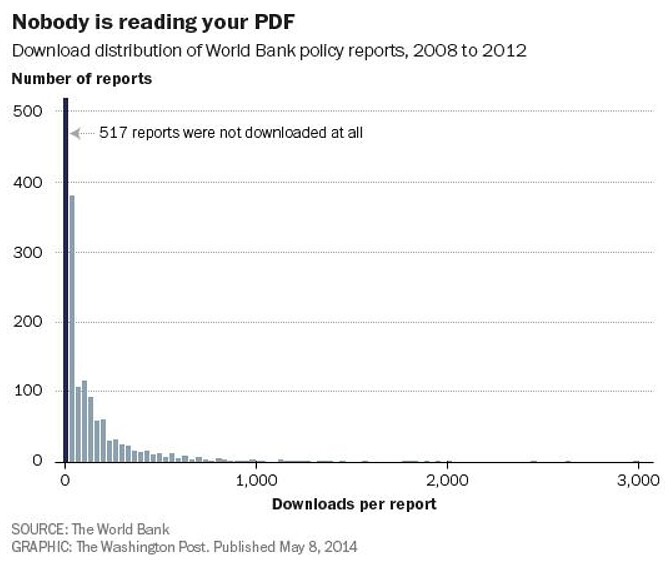
One of the themes that was recurring throughout the session was how Extractive Industry data can be easily lost in EITI reporting. No data is useless data, but how we choose to visualise it can impact its reach and value. A large amount of current EITI data sits ‘locked’ in PDF files and various reports which remain unused and in a number of cases unread. To draw a parallel, the graphic below from a recent article in The Washington Post regarding World Bank policy reports, illustrates this excellently.
Useful Data
This suggests a smarter approach needs to be taken regarding how the EITI is presenting its data to ensure greater efficiency in reporting and a more focused approach in providing results. Workshops were set up with insightful information aimed at showcasing ways of bringing the data back to life. One of these is the use of GIS. GIS mapping provides an excellent opportunity to highlight issues and prompt actual results. The vast amount of information being created in the Extractive Industry needs to be unlocked and made accessible in formats that everyone can access for informed decision-making. MAP-X is at the forefront of this concept and has the potential to shape reports into results.
What can the MAP-X platform do?
The platform can transform transparency information into an open data and interoperable format that is easily accessible for all stakeholders on an interactive platform. In short, it is a powerful tool which can present information in a more compelling and visual format that has a far greater reach than regular reporting. This should therefore prompt more questions to be asked and more actions to be taken.
Key Functionalities
At present, the MAP-X prototype is currently being tested in the Democratic Republic of Congo and Afghanistan.
Key functionalities of the pilot include, but are not limited to:
Mapping Concessions by Type or Activity Status
Stakeholders may select and customise data settings which allow spatial data (the geographic location of the extractive site) to be joined to non-spatial data, such as financial, social and environmental information surrounding Extractive Industries. Layering this data so that different information types can be seen on the same visual map allows for the recognition of issues of a different subject nature, which is highly useful for drawing correlations.
Visualising Conflicting Land Use and Rights
Land use information can be combined with concession information to produce visuals which detect conflicts regarding types of land, usage and ownership. This is extremely useful in highlighting conflicts between extractive processes and protected areas or indigenous people. This once again underlines the ability to utilise the data to tackle issues which impact across different subjects.
Site Specific Performance Monitoring
Using satellite imagery, key extractive sites may be monitored to check progress on site specific data. High resolution images may therefore be utilised at different cross-sectional data points to compare land use change over time. This would be particularly useful in analysing how sites may change relative to how they existed prior to extractive projects.
Making Big Data in the EI More Effective
Numerous challenges have been identified in intregrating new technologies in the EITI process. For one, the interpretation of a vast amount of data still remains contested, and other infrastructural issues such as internet connectivity can make this process less applicable to some parts of the developing world.
In order for the EITI to move forward, GIS mapping can help visualise EITI data and bring some of the key development issues to the forefront. In running with the theme of the conference thus far, this represents a strong opportunity to transition from reports to results.
Greg Chappell Van Gilst is a Policy Analyst for the Global Leadership Initiative (GLI). He is currently finishing BSc in Economics with Finance at the University of Sheffield, UK.


