Is the US-China trade war spoiling international trade statistics?

Vali Stan, Lukas Linsi and Daniel Mügge use research on the US-China trade relationship to argue that states' newfound enthusiasm for protectionist policies will have to face the reality of the global economy.
Something weird is afoot in Chinese-American trade statistics. Traditionally, Washington has reported a trade deficit with China that was higher than the export surplus that Beijing recorded with the USA – even though in theory, the two should match. Such “mirror discrepancies” are the dirty secret of trade figures and belie their putative robustness (see here and here). But they are nothing new. What is new, and puzzling, is that in recent years, the trend has reversed. Now China reports a trade surplus with the USA that is higher than the corresponding American trade deficit – even though the current, fraught politics would suggest the precise opposite: China downplaying the trade asymmetry while the USA exaggerates it to justify corrective measures.
This matters for at least two reasons: first, because much discussion of Western countries’ trade policy vis-à-vis China hinges on perceived developments in trade statistics – and what you see there depends on whose data you trust. Second, trade measurement problems can reveal deeper structural issues. While new narratives of “geoeconomics” applaud the return of the state to the driving seat of the economy, mundane measurement challenges highlight states’ struggle to monitor, let alone steer, global economic activities in desired directions.
So what is going on with trans-Pacific statistics? And how does the Sino-American trade war feed into them? As Brad Setser noted back in 2020, one could always count on Chinese exports to the USA being valued higher in the US trade data than in China’s. Similarly, goods traveling from the US to China appear more valuable in Chinese records. Several factors drive these valuation gaps. For starters, import data commonly includes transit and insurance costs, whereas the export data doesn’t. The OECD estimates this discrepancy to amount to 6.5 percent of the imported goods’ value in US-China trade on average.
Large re-export hubs such as Hong Kong compound the problem. Think about Chinese-manufactured goods headed towards the US, but passing through Hong Kong. In US data, these goods originate in China; Chinese trade directories, in contrast, might list them as exports to Hong Kong. This dynamic, too, inflates US import figures compared to Chinese export statistics. The reporting gaps have been significant. In their consistency, however, they had become the new normal.
All the more surprising, therefore, that the UN’s Comtrade data shows an inverse trend for the past few years. In Figure 1 we plot the evolution of US-China mirror trade statistics over the past two decades. To address known measurement problems in US-China trade, we include trade with Hong Kong and remove estimated average costs of insurance and freight from import values. While the size of the US trade deficit with China/Hong Kong was somewhat larger according to figures collected by US (in orange) than Chinese/Hong Kong customs authorities (in blue) throughout 2000-2018, Chinese/Hong Kong statistics show a substantially larger deficit since 2019. What is more, while US statistics indicate the aggregate trade deficit to have stabilized or even decreased after 2018, Chinese/Hong Kong statistics suggest it to have further grown by about 100 billion USD in most recent years.
Figure 1: Trade balance between the USA and China + Hong Kong, adjusted for CIF-FOB margin (all values in billion USD).
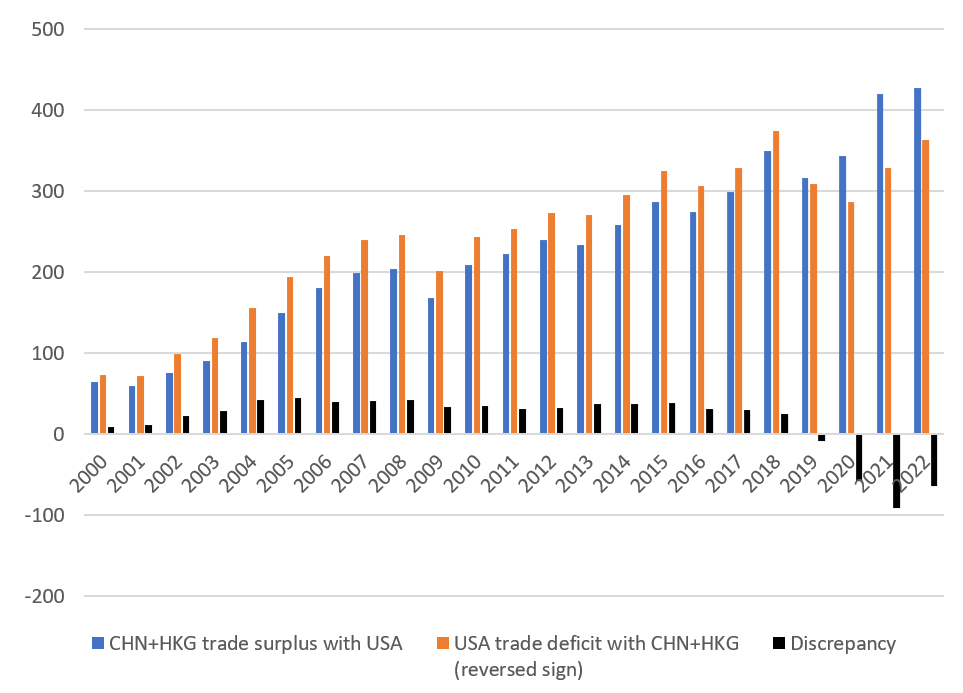
Source: Own calculations based on data from UN Comtrade.
What explains this historical shift? One plausible answer, highlighted by a recent note by the US Fed, is that it’s driven by US importers understating Chinese imports to evade the new tariffs imposed by the Trump and Biden administrations. This could imply that the temporary decrease in the US merchandise trade deficit with China/Hong Kong after 2018 is merely a measurement artefact, driven by tariff-avoiding reporting practices by US firms rather than a real decline in trans-Pacific merchandise trade.
To evaluate that hypothesis, we next examine which product categories have driven the switch in mirror discrepancies and whether they are those subject to the imposition of new tariffs.[1]
Revealed discrepancies are surprisingly large for certain products. For instance, the US reports paying almost twice as much for tin products than China says it exports. At the other extreme, China reports around $2.4 billion worth of exports of tobacco and substitutes, while US data indicates slightly less than $248 million worth in imports--a massive discrepancy both in absolute and relative terms, although tobacco accounts for less than 0.01 percent of total US-bound exports. In the two most important exports to the US in terms of value, electrical goods and machinery (26.1 percent and 20.8 percent of total exports, respectively), we observe the US paying more for the merchandise than stated in Chinese records, while the inverse occurs in other prominent export categories such as clothing and furniture.
How does this tally up against the industries targeted by US import tariffs? In other words, to what degree is the trade war itself the source of distortions in trade figures? To answer that question, in Table 1 we reconciled the additional tariffs imposed on China from the US’s Harmonized Tariff Schedule (HTS) against the most granular UN Comtrade data (at level 6 of the HS nomenclature, in a maximum of 5,306 product variations). Since these import figures are not adjusted for the cost of freight and insurance, we would generally expect import values to be higher. This is not the case for more than a third of all products. We are particularly interested in categories where reported Chinese exports increased relative to reported US imports after the inception of the trade war, because they are the most likely driver of the switch in aggregate discrepancies.
Table 1: Number of goods with discrepancies at level of HS6 products.
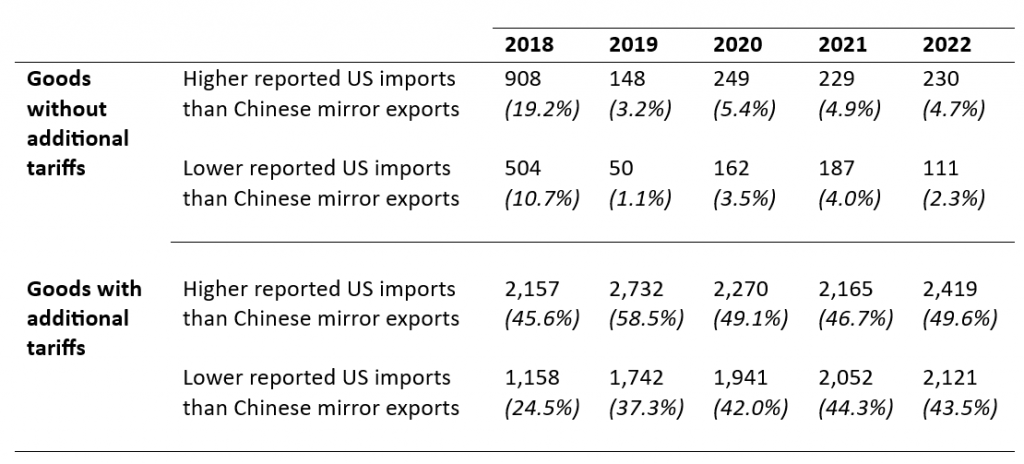
Source: Own calculations based on data from UN Comtrade and the US HTS.
The first thing to note is the considerable breadth of new tariffs: by 2022, more than 93 percent of all export categories were placed under additional tariffs, with rates ranging between 7.5 percent and 25 percent of the goods’ value. Moreover, the average tendency towards potential underreporting by US importers is slightly higher for tariffed goods (43.4 percent of products) compared to non-tariffed ones (36.5 percent), in line with the hypothesis of deliberate underreporting.[2]
But this approach treats all product categories equally, while in reality some are much more heavily traded than others. Table 2 therefore shows the estimated monetary value of these discrepancies.
That allows us to see how much tariffed and non-tariffed goods contribute to the aggregate discrepancy between China’s trade surplus and the (reversed) US trade deficit.
Table 2: Estimated value of discrepancies at level of HS6 products (all values in billion USD).
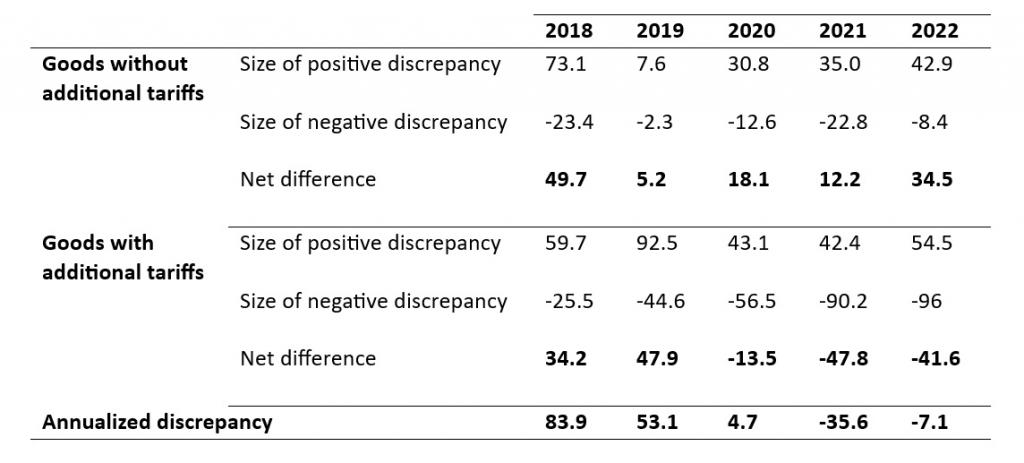
Source: Own calculations based on data from UN Comtrade and the US HTS.
The analysis confirms that negative discrepancies (cases where reported exports from China are higher than respective imports reported in US) are substantially driven by transactions in tariffed goods, with electrical machinery, computer storage units, as well as Christmas articles accounting for the largest discrepancies. These patterns are broadly aligned with the idea that reported decreases in US merchandise trade with China are due to tariff-avoiding underreporting of actual imports. At the same time, this is not the entire story. In fact, we find similar patterns in specific non-tariffed goods like lamps, containers, and telephone sets. Put differently, it’s not just extra-tariffed merchandise that generate the bizarre trade differences observed recently, and part of the US-China trade measurement mystery remains to be illuminated.
Taking a step back, the evolution of these discrepancies may also be telling us a bigger story. The contemporary global economy is an intrinsically complex system. States’ new-found desires to steer international trade and investment in line with geopolitical goals may need to wake up to these realities—and the limitations that come with them. Although protectionist policies certainly can have material consequences (as the switch in the direction of discrepancies attests), firms’ responses to state guidance may be more nuanced and complex than governments recognize (such as under-reporting imports rather than reducing them). For better or worse, putting the genie of corporate globalization back into the bottle will not be easy.
Vali Stan (University of Amsterdam), Daniel Mügge (University of Amsterdam), Lukas Linsi (University of Groningen).
Image: Photo by Nataliya Vaitkevich
Notes
[1] Moreover, the majority of the most relatively underreported goods (i.e., negative discrepancy divided by total US imports) are placed under additional tariffs, and include vessels, steel, and dairy produce. This suggests that US importers underreport Chinese merchandise.
[2] Using the UN Comtrade platform, we examined bilateral data on Chinese US-bound exports to see which traded products have had the highest discrepancies between 2018 and 2022. The widely used Harmonized System (HS) nomenclature groups products into 97 high-level ‘chapters’, ranging from live animals to artworks. We calculated chapter-level discrepancies between US and Chinese data, also dividing them by trade volumes in the respective chapters as reported by the US.


Legitimize Supply Chain Regulation")